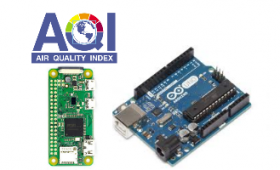
Air quality monitoring IOT ? Arduino & sensors connected to a Raspberry Pi
I was very interested in monitoring the surrounding air’s quality, so I built a box…
I was very interested in monitoring the surrounding air’s quality, so I built a box…
PowerBI and Kylin – reporting from Hadoop via ODBC This article discusses how to setup…

Tableau Desktop supports visual analysis and data discovery, converts the raw information to easy to…
Tutorial big data analysis: Weather changes in the Carpathian-Basin from 1900 to 2014 – Part…

Tutorial big data analysis: Weather changes in the Carpathian-Basin from 1900 to 2014 – Part…

Tutorial big data analysis: Weather changes in the Carpathian-Basin from 1900 to 2014 – Part…

Tutorial big data analysis: Weather changes in the Carpathian-Basin from 1900 to 2014 – Part…

Tutorial big data analysis: Weather changes in the Carpathian-Basin from 1900 to 2014 – Part…

Tutorial big data analysis: Weather changes in the Carpathian-Basin from 1900 to 2014 – Part…

Tutorial big data analysis: Weather changes in the Carpathian-Basin from 1900 to 2014 – Part…

Tutorial big data analysis: Weather changes in the Carpathian-Basin from 1900 to 2014 – Part…
Tutorial big data analysis: Weather changes in the Carpathian-Basin from 1900 to 2014 – Part…